6.2
2. I might enhance this app so that it is a multiple choice quiz by making it so that the app presents a list of responses. I would make it so that only one response is the correct answer, the rest are wrong. I would use indexing when searching for and selecting the correct answer.
6.4
2. I learned that since 2004 student debt has been rising. I also learned that private schools produce more debt than public schools.
3. When it comes to student debt, what is the differnce between private and public schools? If the college is private, then it seems like the student debt will be higher.
4. College tuition prices are rising and this new found data might keep me from looking at certain colleges. Going to a college that will cause a lot of student debt is not a very good financial choice. Although this information is helpful to future college students it brings up the question of privacy, and how the New York Times got all this data. You have to ask yourself, shouldn't student debt be a personal matter?
5. The Student Debt Data set included two visualizations. It showed a graph with one axis representing the tuition and fees and the other axis representing the student debt at graduation. The other visualization was a map of the country with dots respective to the college's location. The first visualization was extremely helpful in finding the student debt data but the second visualization was not very useful, and kind of unnecessary.
6.5
2. True. The app has to send a request to an online database, such as Firebase, and wait until the information is delivered. When the data arrives the app stops and processes the delivered data.
3. By using an external database the data is stored outside of the app and not in a list within the app. Using an external database makes it so the app can just call the data rather than store all the data inside the app.
6.6
1. Describe how using a list of lists allowed the Presidents Quiz app to have more variety.
1. Using a list of lists allowed the President Quiz app to have more variety because it doubled the amount of information the user can access. It also allows the programmer to integrate more elements of randomness. Finally, using a list of lists makes it so the app can be a multiple choice quiz.
6.7
Click on the "+" button.
Click "add chart"
Select pie chart graph
Select Primary Ecosystem
Select cloud forest, rain forest, and dry forest as values
Click "show average"
Click "create" to actually create the pie chart
- Describe the significance of the global variable index. How was it used in this app? Based on your answer, why might indexing be important in programming?
- Using what you have learned about lists and indexing, how might you enhance this app so that it is a multiple choice quiz?
2. I might enhance this app so that it is a multiple choice quiz by making it so that the app presents a list of responses. I would make it so that only one response is the correct answer, the rest are wrong. I would use indexing when searching for and selecting the correct answer.
6.4
- Choose one of the data sets listed above in the Activity section and give a brief description of it. What specifically were the types of data (text, sounds, transactions, etc.) included in the data set you chose?
- What new facts did you learn when exploring the data set? List at least 3 facts.
- Write a question you have about the data set you chose. Now, convert that question into a hypothesis (a statement) with your prediction about the data.
(Hypotheses take the form of "If __________, then _________." For example, a hypothesis about the student debt data could be, "If the tuition costs are higher at an institution, the student debt will be higher." - Identify at least one security and/or privacy concern that is associated with the data in the data set you chose?
- If your data set included a visualization, explain the purpose of the visualization. How would you change or improve the visualization? If it did not include a visualization, describe one that you think would be useful in understanding the data.
2. I learned that since 2004 student debt has been rising. I also learned that private schools produce more debt than public schools.
3. When it comes to student debt, what is the differnce between private and public schools? If the college is private, then it seems like the student debt will be higher.
4. College tuition prices are rising and this new found data might keep me from looking at certain colleges. Going to a college that will cause a lot of student debt is not a very good financial choice. Although this information is helpful to future college students it brings up the question of privacy, and how the New York Times got all this data. You have to ask yourself, shouldn't student debt be a personal matter?
5. The Student Debt Data set included two visualizations. It showed a graph with one axis representing the tuition and fees and the other axis representing the student debt at graduation. The other visualization was a map of the country with dots respective to the college's location. The first visualization was extremely helpful in finding the student debt data but the second visualization was not very useful, and kind of unnecessary.
6.5
- Describe and give an example of the difference between synchronous and asynchronous data access.
- True or False. When an app retrieves data from Firebase, it first requests the data and then it stops whatever it is doing and waits for the data to arrive. Explain.
- One aspect of abstraction is that it helps to reduce details to focus on what's relevant. How does the use of an external database in this app help reduce detail in the program?
2. True. The app has to send a request to an online database, such as Firebase, and wait until the information is delivered. When the data arrives the app stops and processes the delivered data.
3. By using an external database the data is stored outside of the app and not in a list within the app. Using an external database makes it so the app can just call the data rather than store all the data inside the app.
6.6
1. Describe how using a list of lists allowed the Presidents Quiz app to have more variety.
1. Using a list of lists allowed the President Quiz app to have more variety because it doubled the amount of information the user can access. It also allows the programmer to integrate more elements of randomness. Finally, using a list of lists makes it so the app can be a multiple choice quiz.
6.7
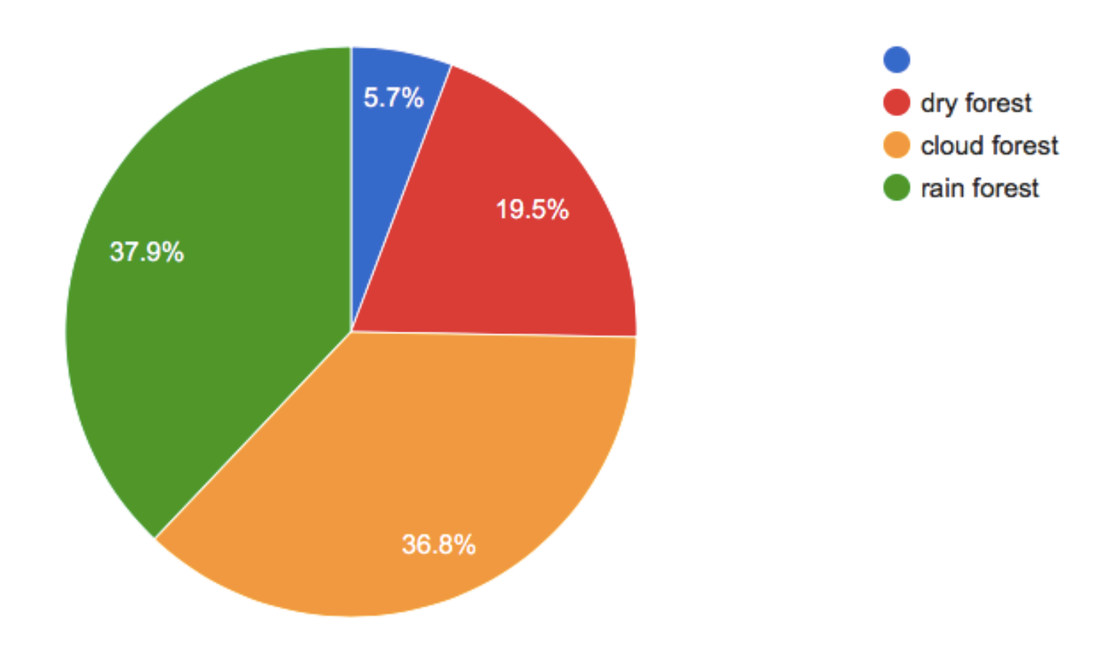
- By filtering and analyzing your data set, create a pie chart that displays the relative percentages of cloud forest, rain forest, and dry forest specimens that occur in the data set. Describe the procedure you used to create the pie chart and copy and paste the chart into your portfolio page. Having troubles working with your chart? Watch this video for some tips and tricks.
Click on the "+" button.
Click "add chart"
Select pie chart graph
Select Primary Ecosystem
Select cloud forest, rain forest, and dry forest as values
Click "show average"
Click "create" to actually create the pie chart
6.9
- Identify a procedure that you defined or modified to solve the tasks involved in this problem and describe how it helps reduce the overall complexity of the program. Provide a screenshot of the appropriate blocks.
- In your code, identify the algorithm you used to query the FirebaseDB for the quiz data. Explain the asynchronous nature of the algorithm. Provide a screenshot of the appropriate blocks.
